
After reading this post on Gawker about New York City subway delays, I was intrigued by how the information was (or could be) framed. The article mentions that 78.8% of New York City subway trains were on time in 2014. Mathematically, that suggests (as the article mentions as well) subway trains are late 21.2% of the time.
This got me thinking…what do people perceive as an acceptable rate for trains to be on time? What do people perceive as an acceptable rate for trains to be late? Look at those two questions again. Virtually the same question but framing the information in a slightly different way may influence perceptions. Thus, half of the people who answered the survey saw the following:
One report estimates that New York City subway trains are on time 78.8% of the time. Given a variety of potential issues (weather, construction, etc.), what do you think is a reasonable percentage for trains to be on time?
The other half saw…
One report estimates that New York City subway trains are late 21.2% of the time. Given a variety of potential issues (weather, construction, etc.), what do you think is a reasonable percentage for trains to be late?
Again…basically asking the same question but framed in a different way. One is positive (on time) while one is negative (late). Why is this important? As I’ve shown in previous posts, we tend to perceive things differently when framed in a positive versus negative manner. So let’s see if it applies here…
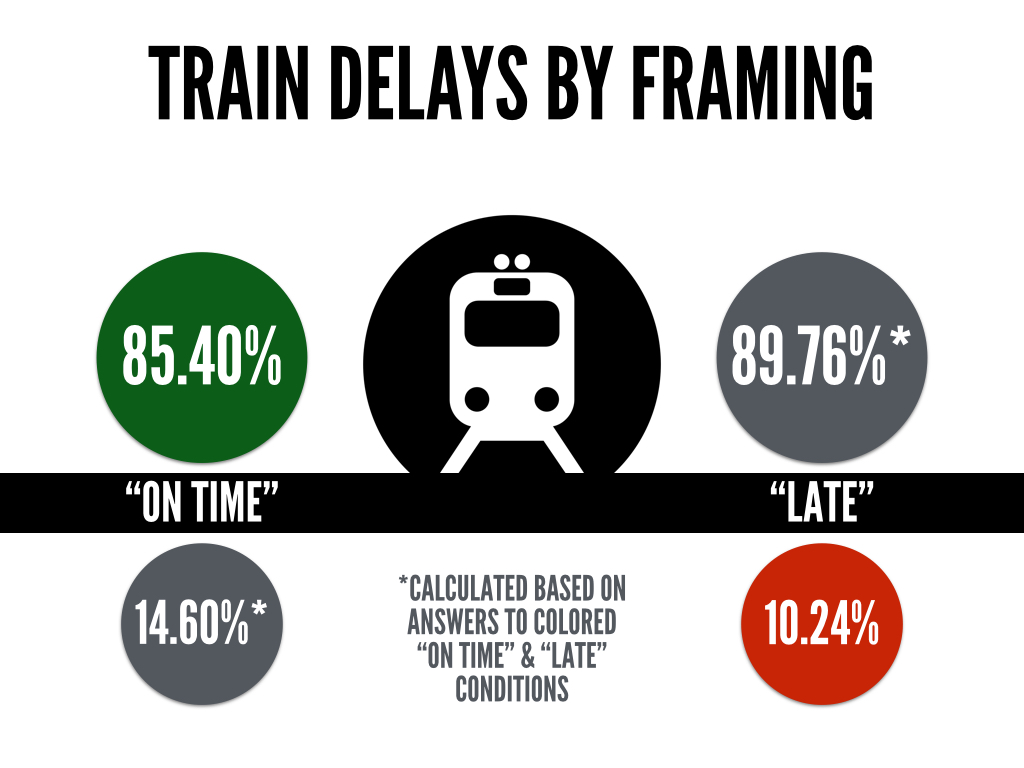
NOTE: Respondents answered what they thought was a reasonable percentage for trains to be on time (green circle) and reasonable percentage for trains to be late (red circle). The other two gray circles (with asterisks) were calculated to allow for easier comparison.
What do you notice?
There is a fairly big difference in what respondents thought was a reasonable rate for trains to be delayed depending on whether they were asked about them being “on time” versus “late”. Respondents thought 85.40% was a reasonable percentage for trains to be on time and 10.24% was a reasonable percentage for trains to be late. That adds up to 95.64% which suggests the on time versus late framing influenced responses.
Accepting 85.40% as a rate for trains to be on time (green circle) suggests 14.60% is a reasonable time for trains to be late. Similarly, if trains being late 10.24% of the time (red circle) is reasonable that suggests that a 89.76% on time rate is acceptable. Essentially, people thought 85.40% was a reasonable rate for trains to be on time in the “on time” condition and 89.76% was reasonable for trains to be on time in the “late” condition*.
*You could argue that people answering the “on time” scenario were also considering trains being early. Based on cues in the question (suggesting issues with weather, etc.) though it was pretty clear the question wasn’t asking about early trains. Thus, the calculations were done (shown above) to provide an easier comparison between people in the “on time” condition and people in the “late” condition.
What might play a role?
Positive versus negative framing. As mentioned, the information was either framed as a positive (on time) or negative (late). This influenced responses and it appears people are less tolerant with trains being “late” (10.24%) and more tolerant with trains being “on time” (85.4%). It should be the same. Again, those two numbers should add up to 100% but they don’t. Thus, the positive versus negative framing appears to have influenced perceptions.
Number anchoring. The numbers used in the question (78.8% and 21.2%) may have inadvertently, and unequally, anchored people. In other words, people might interpret 78.8 and 21.2 in unique ways. For example, maybe the ones digit (8 vs. 2) led people to stray further, or remain closer, to the number provided. The nature of the numbers (big versus small, odd versus even, etc) may influenced numerical perceptions.
So what is the takeaway?
Pay attention to how information is framed. Are you presenting “on time” rates to customers or “late rates”? We generally talk in positive statements. Think about sports. Batting average in baseball is the number of hits divided by at bats and NOT the number of non-hits divided by at bats. We reference winning percentage (wins/games) and NOT losing percentage (losses/games). What happens if you frame the information in a negative way instead of a positive way? Or vice versa? This post shows how positive versus negative framing can influence people’s perceptions.
What are some other business scenarios where you could frame the same information as positive or negative? Where do you see information presented in a positive manner (“on time”) when it could be presented in a negative (“late”) manner? Let me know in the comments.
_______
#1QFriday is a blog series that includes my random thoughts and musings. I do not claim to be the first person to think of these things or deny that others have done research on them. I am simply discussing interesting marketing, psychology and linguistic topics that come to mind. Furthermore, I am avoiding fancy statistical analysis as I want the emphasis to be on the ideas. I recently read (Amazon affiliate link) Paul Grice: Philosopher and Linguist and was inspired by a less statistical and more philosophical approach. Thus, the results here could happen by chance. I want to focus on thinking about, discussing and debating the ideas at a broad level rather than whether or not the differences are statistically meaningful. I typically send out a quick survey on Friday and post an analysis/discussion the following week.